
Arsya Auliati B.
Welcome to my portfolio! I'm passionate about data and analytics, and this is where I showcase my projects and skills. From using Python for data analysis to creating interactive visualizations with Power BI, I'm excited to share my journey and projects with you. Explore my work and let's connect!
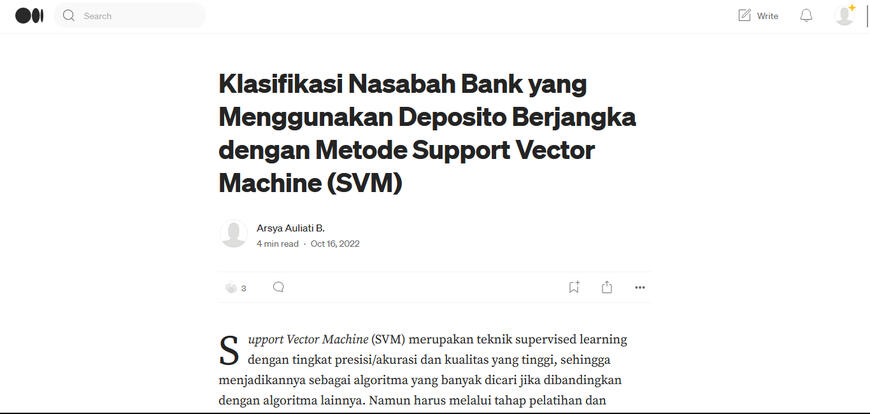
Classification of Bank Customers using Support Vector Machine
Using RStudio
Support Vector Machine (SVM) merupakan teknik supervised learning dengan tingkat presisi/akurasi dan kualitas yang tinggi...
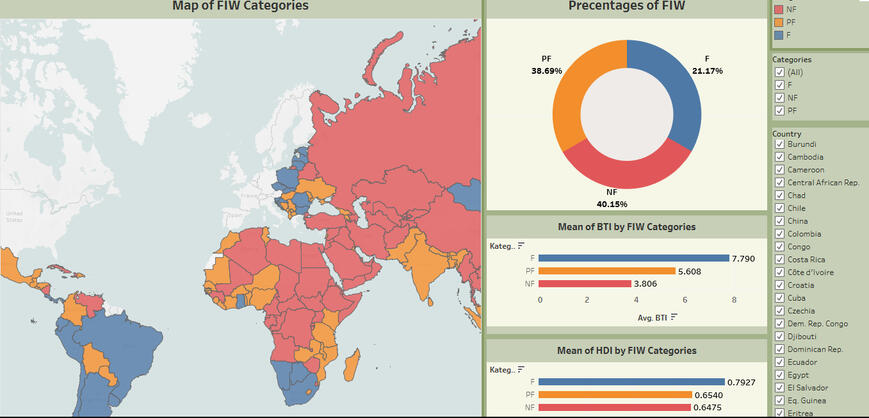
Dashboard Freedom In The World Using Tableau (Internship Task)
Political, economic, and social transformation of countries in the world can be known through some index of results from research institutions / organizations. Several indexes...
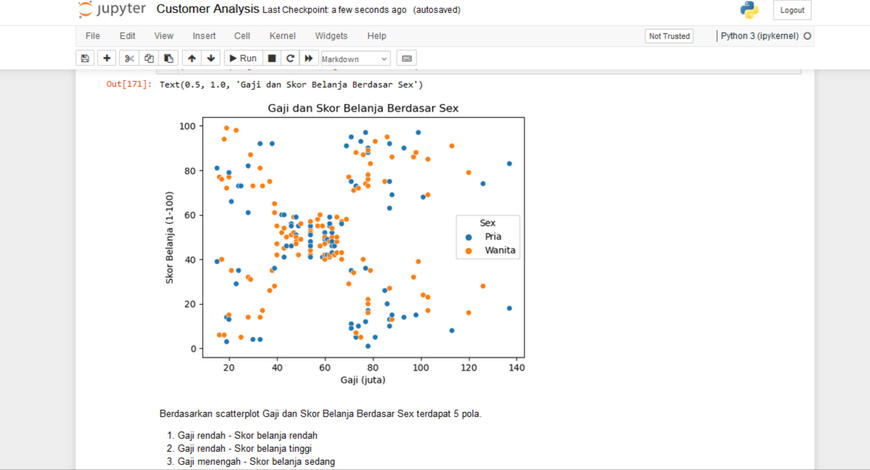
Customer Analysis with Statistics Descriptive
This customer analysis contains simple analysis such as distribution of data using histograms, correlations, and scatterplot.
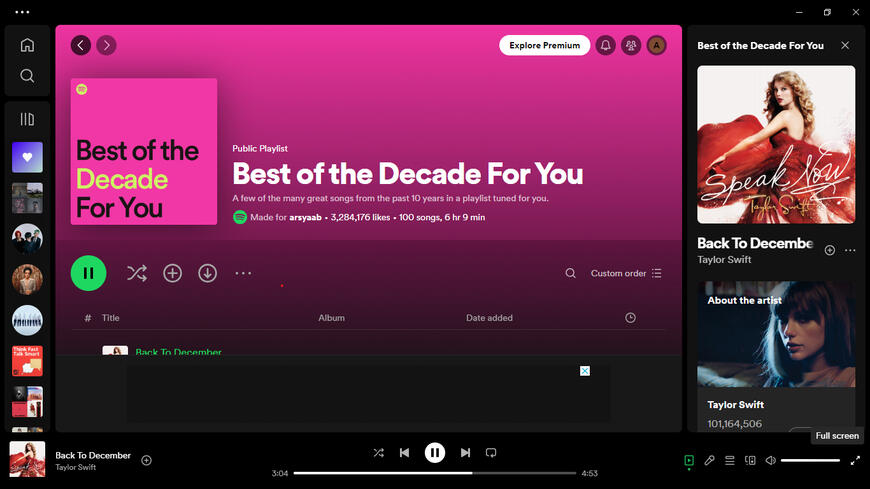
Exploring Spotify: Unveiling Patterns with Spotify API and K-Means Clustering Using Python
This Spotify Project is about collecting data using Spotify API, then doing Exploratory Data Analysis (EDA), and clustering using K-Means.
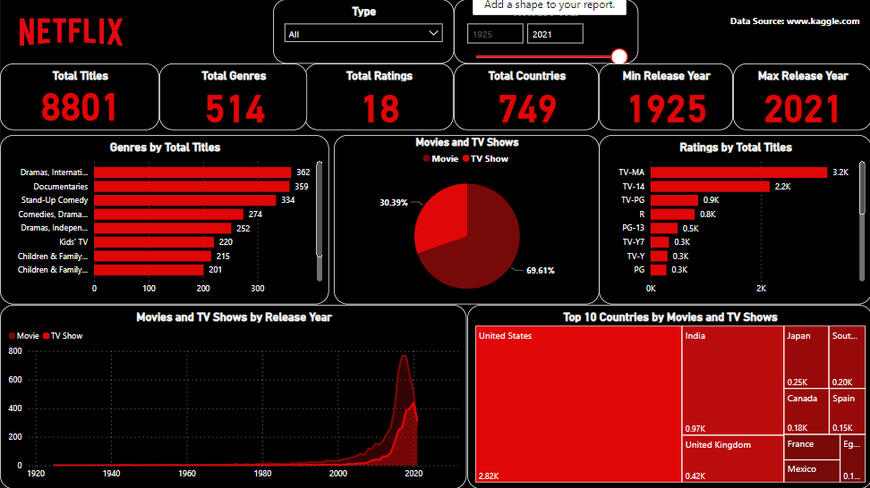
Netflix's Dashboard with Power BI
Netflix's Dashborad is a data set was created to list all shows available on Netflix streaming, and analyze the data to find interesting facts. This data was acquired in July 2022 containing data available in the United States.
NLP Project with Tokopedia Data Scraping and Sentiment Analysis
Applied NLP to Tokopedia data via web scraping. Extracted product info like descriptions, reviews, ratings. Analyzed using sentiment analysis with Random Forest, SVM, and Naive Bayes.